
Google’s Nano Banana is the start of a Massive AI Trend [Markets]
Pricing the Rise of Diffusion Models as an alternative to building LLMs

It takes time to create work that’s clear, independent, and genuinely useful. If you’ve found value in this newsletter, consider becoming a paid subscriber. It helps me dive deeper into research, reach more people, stay free from ads/hidden agendas, and supports my crippling chocolate milk addiction. We run on a “pay what you can” model—so if you believe in the mission, there’s likely a plan that fits (over here).
Every subscription helps me stay independent, avoid clickbait, and focus on depth over noise, and I deeply appreciate everyone who chooses to support our cult.
PS – Supporting this work doesn’t have to come out of your pocket. If you read this as part of your professional development, you can use this email template to request reimbursement for your subscription.
Every month, the Chocolate Milk Cult reaches over a million Builders, Investors, Policy Makers, Leaders, and more. If you’d like to meet other members of our community, please fill out this contact form here (I will never sell your data nor will I make intros w/o your explicit permission)- https://forms.gle/Pi1pGLuS1FmzXoLr6
Editorial Note- I’ll use Transformers to refer to standard Autoregressive Transformers (next token predictors) and Diffusion Models to refer to well… DMs. This is for clarity.
The internet has been going ape-shit over Google’s new image model — Nano Banana. While all the images generated it generated were cool, all the conversations around the raw generation capabilities distract us from a larger trend. To accomplish the editing capabilities, Google relies on diffusion. This is the second major Diffusion LM released by Google in the last few months, and the first that’s directly plugged into their Gemini Flagship model. Other major labs are also integrating diffusion models directly within their ecosystems. This is a much bigger deal than people realize.
For more than a year now, our research at the Chocolate Milk Cult has been flagging the rise of Diffusion Models. This was based on 3 pillars-
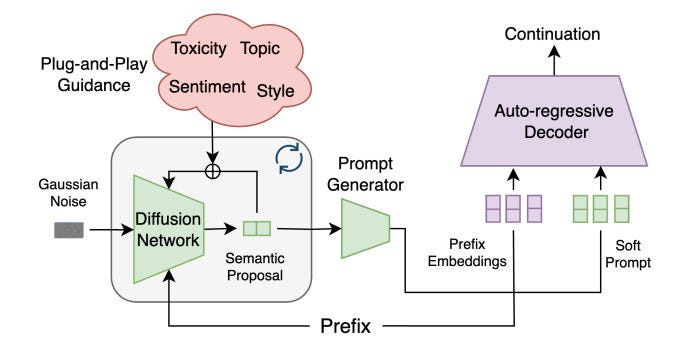
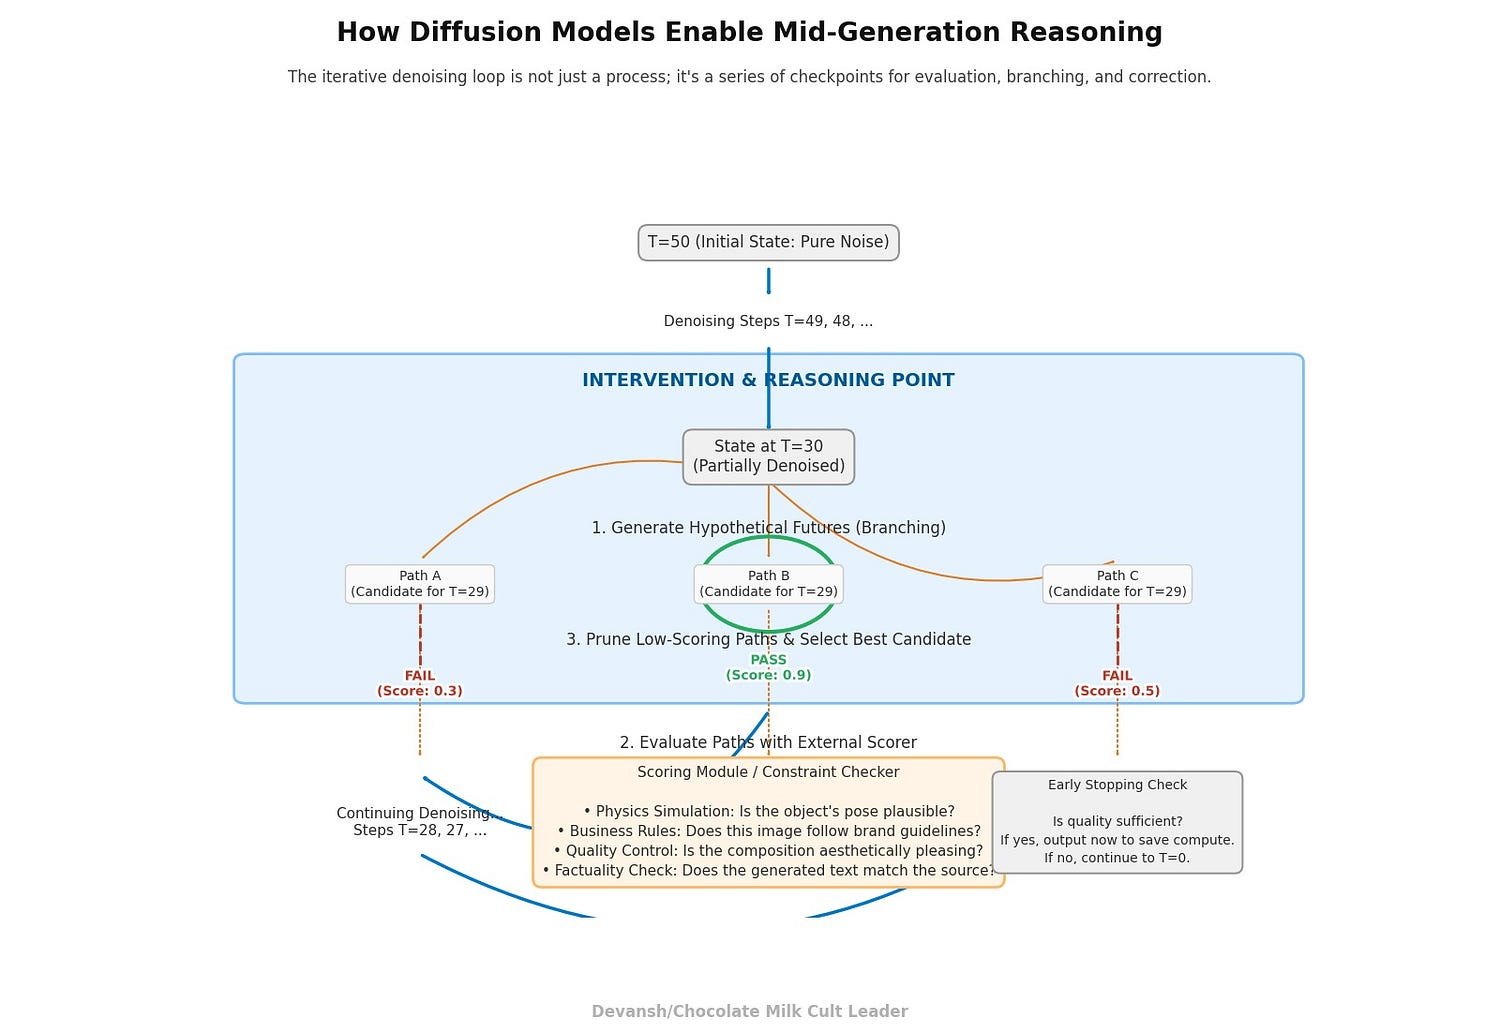
Diffusion Models allow for mid-generation reasoning thanks to their iterative denoising loop. This makes them much superior for integration with specific controls (style, content guidelines, etc), simulations, and many other complex use cases. This idea was explored in depth here, and a practical example of how this approach can align language models using plug-and-play controllers (and avoiding expensive retraining was covered below.
The above denoising process also allows us to improve the interpretability of our Deep Learning systems, addressing one of the biggest adoption barriers in the current AI ecosystem.
AR Transformers and GPUs were not originally co-designed for each other; they happened to match for scaling. As AI-specific hardware takes center stage, different models (w/ different inductive biases) will take over. Diffusion models are particularly suited here since they align with a few larger macro trends in the industry — inference time scaling, higher memory chips, integrated reward models, and agentic evals — all of which either make DMs more viable (the first 2) or significantly more powerful (the last 2).
Over the last few months, I’ve relied on the extensive CMC networks to beg, borrow, and steal my way into accessing reports from major AI labs and several organizations operating AI at scale. We reviewed LLM training logs, conducted our own ablation studies, mapped supply chains, and more to thoroughly explore and model the rise of Diffusion Models.
This report provides an analysis of the diffusion model value chain, built on priced physics and operational constraints rather than hype. We argue that the alpha is not in the models themselves, which are commoditizing quickly, but in solving four systemic choke points that govern whether diffusion can scale:
Algorithmic Efficiency: Software breakthroughs have collapsed the “steps tax,” cutting inference costs by multiples on the same hardware.
Physical Supply Chains: The availability of High-Bandwidth Memory and advanced packaging capacity dictates how fast the market can grow.
Deterministic Serving: In latency-sensitive applications, the product is not average speed but guaranteed p99 performance — a niche where challengers can attack incumbents.
Provenance and Trust: Compliance, IP indemnification, and content labeling are no longer optional; they are per-asset taxes that reshape the economics.
The sections that follow map each of these choke points to specific investment opportunities, from bandwidth vendors and liquid-cooling providers to workflow-moat applications and speculative silicon bets. The goal is to give decision-makers a clear view of where to deploy capital. To help them graduate from chasing models to owning the bottlenecks that will define this market’s scale. To steal a metaphor from
— in a gold rush, don’t dig for gold or sell shovels— control the points through which capital flows.Executive Highlights (TL;DR of the Article)
Background What is Diffusion
Here is a very quick description of Diffusion Models, for completeness' sake.
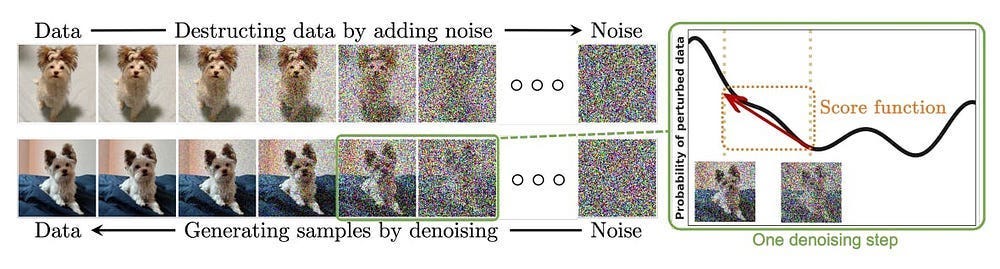
What are Diffusion Models in Machine Learning: Diffusion Models are generative models (they generate data similar to what they were trained on). Diffusion Models follow 2 simple steps. First, we destroy training data by incrementally adding Gaussian noise. Training consists of recovering the data by reversing this noising process. A well-trained Diffusion Model can create whatever we want from a pool of random noise. Replace noise with a space of embeddings, and you can probably see why we’re cooking here.
The advantages of DMs: Diffusion models have 3 major advantages that make them strong contenders for your generation based tasks- High-Quality Generation: Diffusion models generate data with exceptional quality and realism, surpassing previous generative models in many tasks; Versatility: They are applicable to a wide range of data modalities, including images, audio, molecules, etc; and Controllability: Diffusion models offer a degree of control over the generation process, allowing users to guide the output based on specific requirements or conditions.
The Drawback of Diffusion Models- As should be evident by their design, DMs are very expensive. There is research to mitigate their costs, but this is still a sore spot for DMs.
Read our already linked deepdives to learn more about the technical details if you’re interested.
Main Article
The economics of Diffusion Models have changed dramatically. Algorithmic breakthroughs (LCMs, rectified flows, high-order solvers) slashed step counts, delivering ~7x cheaper inference on the same GPUs. That software dividend entrenches NVIDIA’s CUDA moat, since rivals can’t justify the “porting tax” without a structural advantage. The battlefield splits:
Throughput workloads (bulk generation) belong to GPUs.
Latency-sensitive apps (p99 contracts) are the only viable wedge for alternative silicon.
The value chain revolves around four systemic choke points:
Algorithmic efficiency — collapsing the steps tax drives the biggest cost gains.
Physical supply chains — HBM and CoWoS packaging set the ceiling for accelerator output.
Deterministic serving — predictable p99 latency is the only credible path for GPU challengers.
Provenance & trust — compliance and indemnification are now per-asset taxes.
Frontiers expanding TAM:
Video — the fight to break the $1/minute barrier.
Edge — achieving ≤5W sustained diffusion for phones, laptops, and cars.
Portfolio logic:
Tier 1 (Core, now): HBM vendors, packaging houses, liquid-cooling, compliance rails.
Tier 2 (0–18mo): Efficiency software and p99 SLA platforms.
Tier 3 (12–36mo): Workflow-moat applications in regulated verticals.
Tier 4 (18–60mo): Deterministic silicon, video, and next-gen interconnect bets.
Risks: one-step parity (commoditization), drift back to transformer-heavy architectures, HBM/packaging slips extending incumbency, and harder-than-expected compliance taxes.
Bottom line: diffusion models themselves are commoditizing; the durable value lies in bottlenecks — memory, packaging, cooling, compliance — and in selective bets on latency, video, and edge. Winners won’t be those chasing the next model; they’ll be the ones who own the physics.
I put a lot of work into writing this newsletter. To do so, I rely on you for support. If a few more people choose to become paid subscribers, the Chocolate Milk Cult can continue to provide high-quality and accessible education and opportunities to anyone who needs it. If you think this mission is worth contributing to, please consider a premium subscription. You can do so for less than the cost of a Netflix Subscription (pay what you want here).
I provide various consulting and advisory services. If you‘d like to explore how we can work together, reach out to me through any of my socials over here or reply to this email.
1. The Baseline Economics of Diffusion Models
To understand the diffusion value chain, one must first grasp its unique economic profile. Unlike many machine learning workloads that are primarily bound by floating-point operations (FLOPS), diffusion model inference is fundamentally constrained by memory bandwidth. The iterative denoising process requires the repeated reading and writing of large activation tensors to and from high-bandwidth memory (HBM), creating a sequential dependency that defines its cost structure.
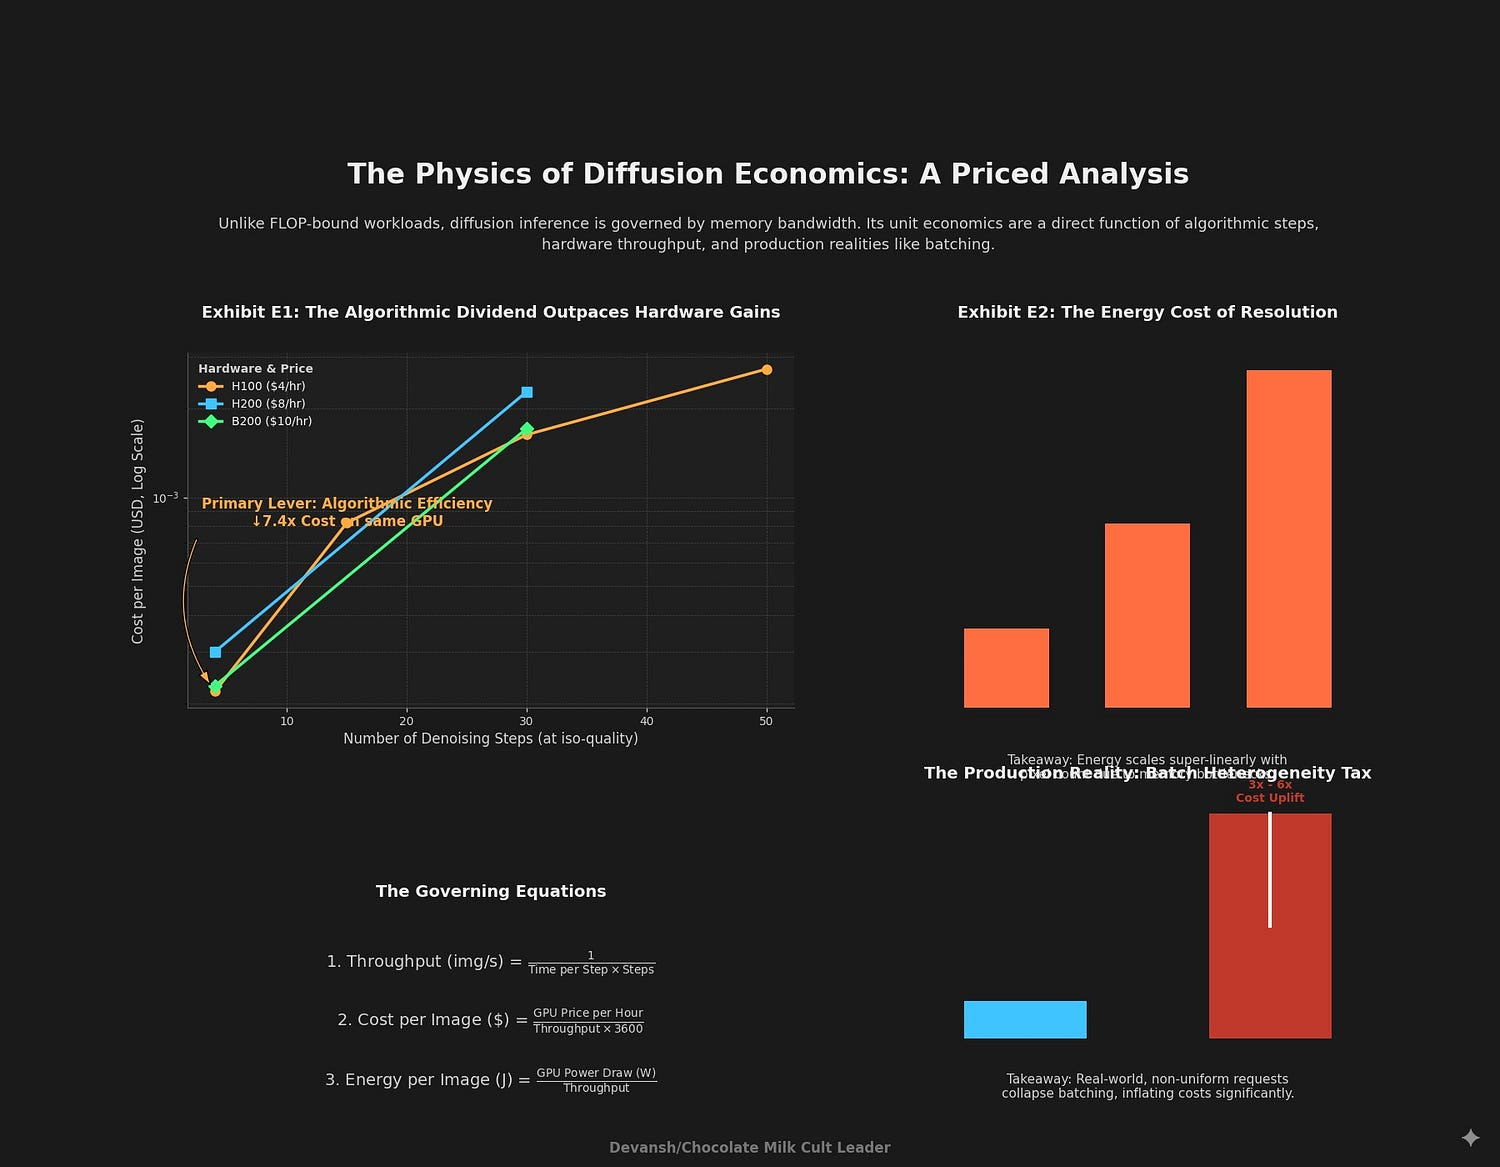
In more detail, we see that the unit economics are governed by four key equations:
Throughput (images/sec) = 1 ÷ (Time per Step × Number of Steps)
Cost per Image ($) = GPU Price per Hour ÷ (Throughput × 3600)
Cost per 1M Images ($) = Cost per Image × 1,000,000
Energy per Image (Joules) = GPU Power Draw (Watts) ÷ Throughput
These formulas allow us to model how changes in algorithms (fewer steps), hardware (higher bandwidth, different rental prices), or workload (higher resolution) directly impact the P&L.
Exhibit E1: Iso-Quality Cost Curve — Steps vs. $/Image
The most powerful lever for cost reduction is not hardware, but the reduction of sampling steps required to achieve a target quality level. The following table illustrates the cost per image across hardware generations, assuming a cloud rental price of $4/hr for H100, $8/hr for H200, and $10/hr for B200 (exact numbers aren’t that important since our focus in on step reduction on the same setup). The baseline is an SDXL-class model on an H100, which achieves ~0.68 img/s at 30 steps. Throughput is scaled inversely with step count and proportionally with memory bandwidth improvements.
Steps   GPU     Modeled Throughput (img/s)   Cost per Image ($)
-----------------------------------------------------------------
50      H100    ~0.41                        $0.00272
30      H100    0.68                         $0.00163
15      H100    ~1.36                        $0.00082
4       H100    ~5.10                        $0.00022

30      H200    ~0.97                        $0.00228
4       H200    ~7.28                        $0.00030

30      B200    ~1.62                        $0.00171
4       B200    ~12.15                       $0.00023
Simply put, reducing steps from 30 to 4 on the same H100 GPU provides a 7.4x cost reduction. This algorithmic gain far outweighs the performance uplift from upgrading to next-generation hardware, where higher rental prices can negate the throughput advantages for high-step workloads.
Exhibit E2: Resolution vs. Energy per Image (Joules)
Energy consumption, a direct driver of operational cost and data center strain, scales super-linearly with image resolution due to the quadratic growth of activation maps. High-resolution workloads that exceed on-chip SRAM capacity incur severe “tiling penalties,” further increasing energy use as data is repeatedly moved.
Resolution   GPU     Estimated Energy per Image (Joules)
---------------------------------------------------------
512²         H100    ~1,030 J
768²         H100    ~2,400 J
1024²        H100    ~4,400 J
Here we see that doubling the image side length (a 4x increase in pixels) increases energy consumption by more than 4x. High-resolution generation is a primary driver of the extreme power and thermal densities seen in AI data centers.
The Production Reality: The Batch Heterogeneity Tax
The throughput figures above assume idealized, large-batch processing. In a real-world API deployment, incoming requests are heterogeneous — each with a different prompt, seed, and configuration. This reality collapses batching efficiency, often reducing the effective batch size to 1 or 2. This dramatically lowers hardware utilization and increases cost.
This is extremely important, so I will repeat it. Production cost models must apply a 3x to 6x cost uplift multiplier over idealized, benchmark-derived figures to account for the economic impact of batch heterogeneity. A service priced on lab benchmark will be unprofitable in production.
Note to reader- see NVIDIA Triton guidance
2) How Algorithmic Improvements led to the cost of Diffusion Models dropping
The baseline economics established in the previous section are not static. Between 2023 and 2025, DM researchers went into clutch mode to slash costs, delivering a massive performance dividend on existing hardware.
This shift was driven by a new class of samplers and modeling techniques that achieve high-quality outputs, passing standard perceptual quality gates (e.g., maintaining a low delta on FID/CLIP scores), in a fraction of the steps. Key innovations include:
High-Order Solvers: Methods like DPM-Solver++ reduced the required steps for quality from 50+ down to a 15–20 step range without retraining.
Consistency and Latent Consistency Models (LCMs): These models are trained specifically to map noise directly to a clean image, enabling high-fidelity generation in just 2 to 8 steps.
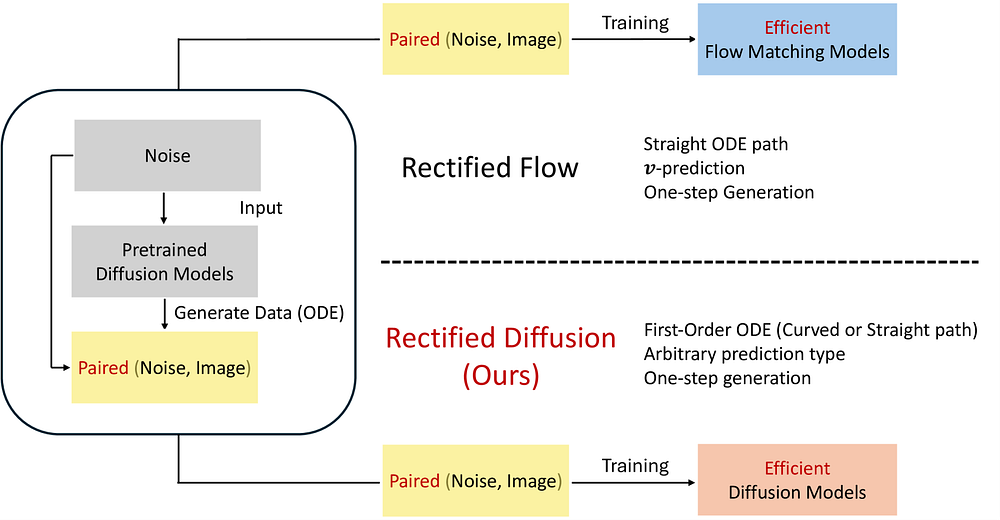
Rectified Flows: An alternative approach that also achieves excellent one- or two-step generation quality through improved training techniques.
A tangent I found very interesting: it seems like a lot of Diffusion research happens in China. Even recent advancements, such as Diffusion-Based Reasoning, came out of there. I wouldn’t be surprised to see major breakthroughs come through the Chinese AI Labs.

All of these really cut down on the inference costs of DMs, a variable worth considering given the inference focus in modern (less than 1 week ago) AI.
Exhibit E3: “Old Floor vs. New Floor” Cost Bands on Identical GPUs
This exhibit compares the cost per million images for an “Old Floor” (a well-optimized 30-step process) versus the “New Floor” (a 4-step consistency model) running on the same NVIDIA H100 GPU at $4/hr.
Metric                  Old Floor (30 Steps)      New Floor (4 Steps)
-----------------------------------------------------------------------
Throughput (img/s)      0.68                      ~5.10
Cost per Image ($)      $0.00163                  $0.00022
Cost per 1M Images ($)  $1,630                    $220
Takeaway: The algorithmic dividend created a ~7.4x reduction in the cost of inference. This gain was achieved entirely through software, requiring zero capital expenditure on new hardware.
This is turning Bale from an LB to a Winger levels of gainnz. This efficiency has an interesting, quite unexpected, result on the ecosystem.
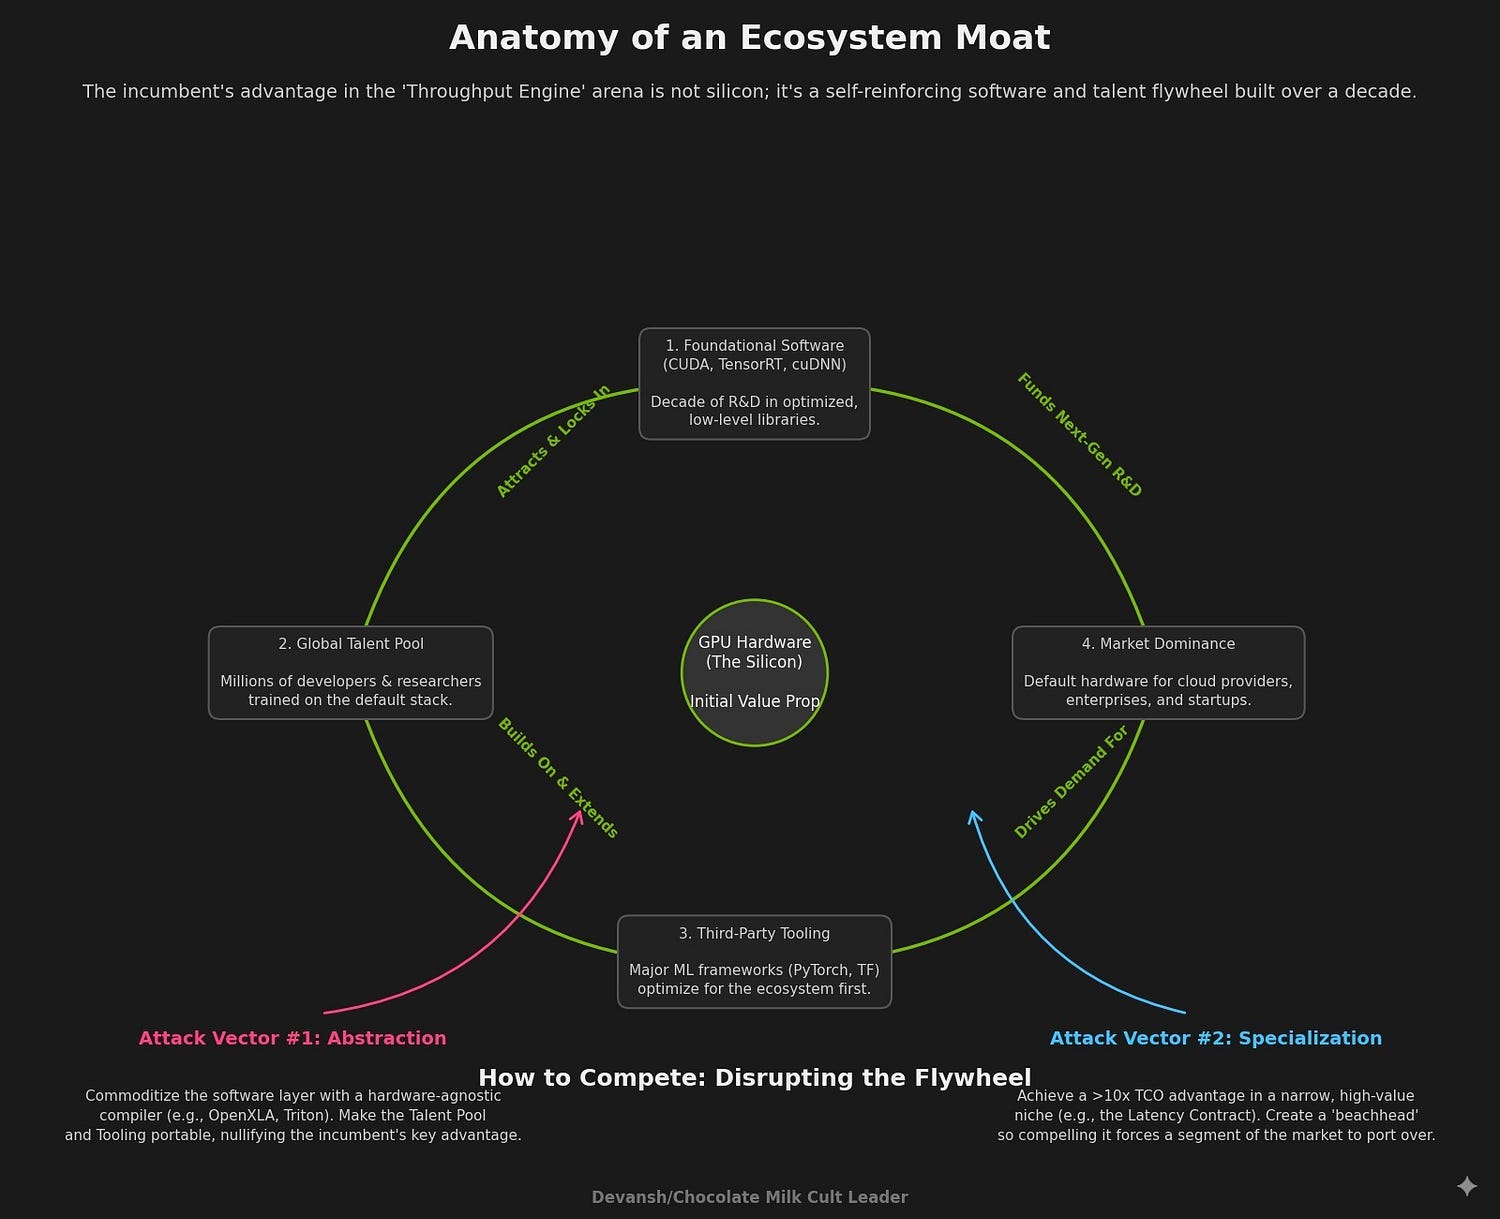
How the lower cost boosts the CUDA Moat
Paradoxically, this software-driven victory for efficiency has made the hardware market less competitive. It dramatically raises the bar for any challenger to NVIDIA’s CUDA ecosystem.
The cost of switching to an alternative hardware platform — the “Porting Tax” of engineering hours, toolchain instability, performance validation, and operational overhead — is high. Previously, a challenger could promise a 2–3x performance gain to justify that tax. But why would an enterprise pay the high and uncertain Porting Tax when they just received a 7x performance dividend for free via a software update on their existing, stable platform?
PS- A lot of startups make similar mistakes, thinking that their improved performance (even if real) will convince enterprises to switch from their vendors to the startup. In reality, inertia, political interests, and the Porting Tax add to the premium needed. Always account for these if your early-stage GTM involves enterprise clients, especially for settled markets.
In my home city (New Delhi), and probably in many other places in the world, roadside Romeos often turn to talking about how much they love the girl when they have no other means of convincing said girl to date them or to pick them over more desirable candidates (“he’ll never love you like me!”). While tempting to make fun of them, competitors to the rich and eligible Nvidia might benefit from taking notes.
It is no longer enough to be faster or cheaper than a multi-step GPU process. The algorithmic dividend forces challengers to compete on a different axis. To win, they must now offer a capability that the incumbent’s architecture is structurally unable to provide.

This sets the stage for the market’s great bifurcation. That is what we will discuss next.
3. The Bifurcated Battlefield for Diffusion Inference
The market for diffusion inference has split into two distinct, non-overlapping arenas, each with its own rules, metrics, and winners. We must understand both before allocating any resources, or we risk finding ourselves in a Manchester United class sinkhole.
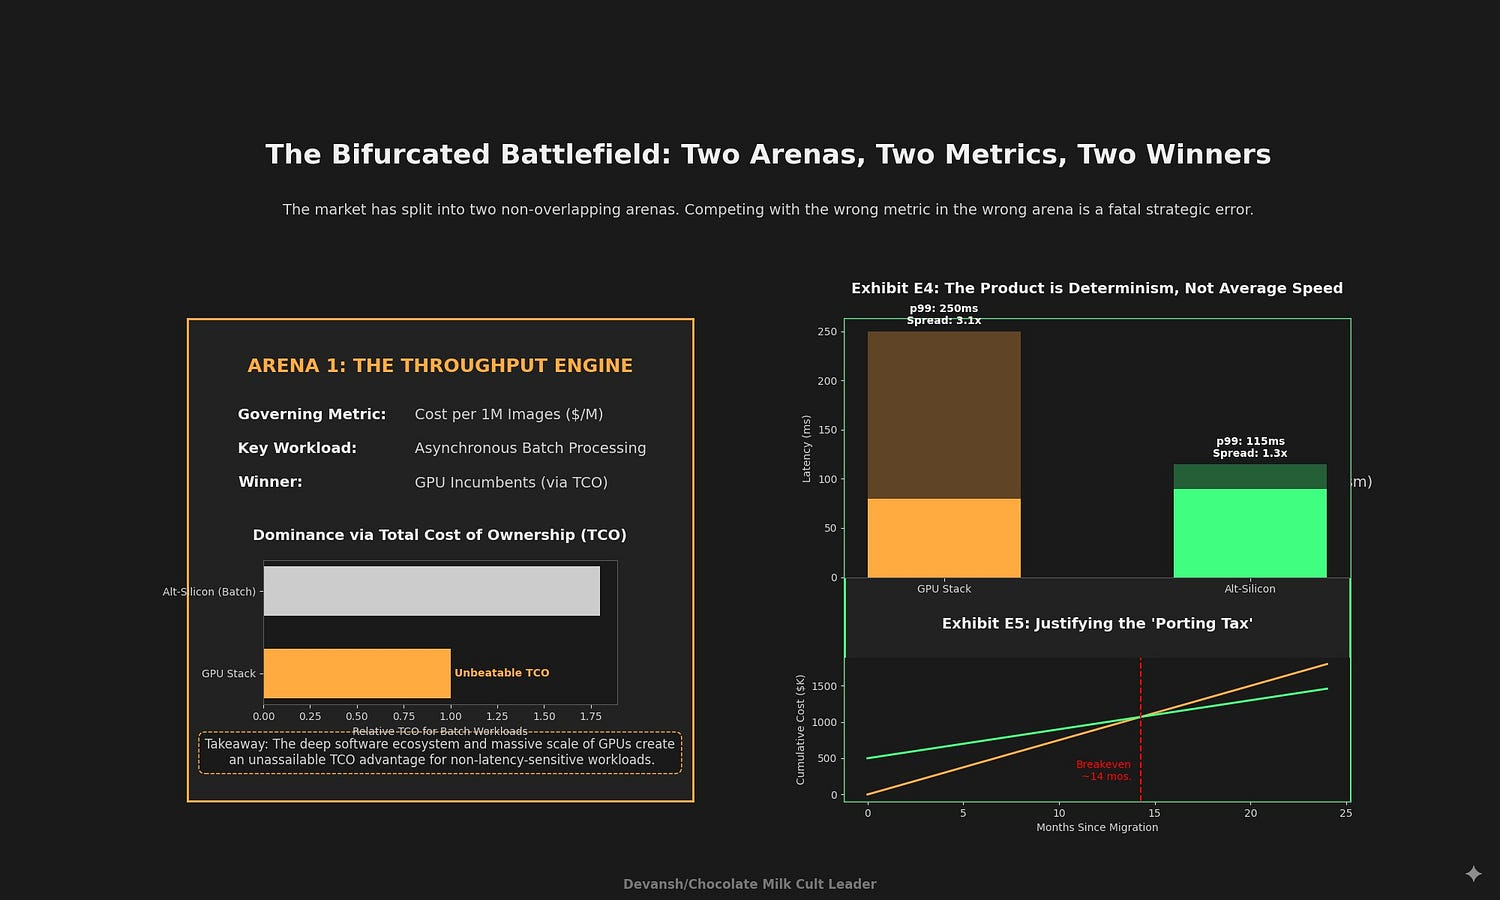
The Throughput Engine: A War of Attrition
This arena is defined by asynchronous, batch-processing workloads where latency is irrelevant. Use cases include generating marketing assets, e-commerce catalogs, and synthetic data for training other models. The only metric that matters is cost per million images ($/M). This is a game of pure operational efficiency and Total Cost of Ownership (TCO).
In this arena, the GPU incumbents, particularly NVIDIA, have an almost unassailable advantage. Their dominance is not just in silicon, but in the deep, mature software ecosystem (CUDA, TensorRT, cuDNN) optimized over a decade for maximizing throughput. For these workloads, the combination of high utilization via batching, robust tooling, and a vast talent pool makes the GPU TCO exceptionally difficult to beat.
If you’re interested in this arena, study up on ecosystem plays. You live and die by your ecosystem, and your ability to disrupt other people’s ecosystems by commoditizing key drivers of value.
The Latency Contract: The Open Market
This arena is defined by synchronous, interactive applications where a human user is waiting for a response. Use cases include real-time creative tools, API-driven services, and virtual assistants. The governing metric here is not average speed (p50), but tail latency (p99). A user’s experience is defined by the worst-case response time, not the average.
Here, the product being sold is determinism — a predictable, guaranteed Service Level Agreement (SLA). This is the only viable beachhead for alternative silicon (ASICs, wafer-scale architectures). GPUs, designed for massive parallelism, often suffer from scheduling jitter and kernel launch overhead that create long, unpredictable performance tails. Architectures designed for deterministic, compiler-scheduled dataflow can offer a structurally superior solution by minimizing performance variance.
Exhibit E4: p50/p95/p99 Latency Curves — GPU vs. Deterministic Alt-Silicon. Illustrative latency profile — representative of architecture differences; not a measured diffusion benchmark.
This exhibit illustrates the performance profiles for a 102⁴² image using a 4-step process. Note the difference in the spread between the average (p50) and worst-case (p99) latency.
Platform                 p50 (ms/img)   p95 (ms/img)   p99 (ms/img)   Spread (p99/p50)
-------------------------------------------------------------------------------------
GPU (e.g., H100)         80             180            250            3.1x
Alt-Silicon (e.g., ASIC) 90             105            115            1.3x
While the GPU may have a comparable or even slightly better average latency, its worst-case performance is over 3x slower. The alternative silicon delivers a tight, predictable performance band, which is a fundamentally different and more valuable product for latency-sensitive applications.
Exhibit E5: The Porting-Tax Payback Model
A company must justify the high, one-time “Porting Tax” with a clear return on investment. Let’s look at the scenario to see if we can come up
The Porting Tax (Cost): This includes FTE-months for software engineering, toolchain integration, extended performance validation, and the higher operational burden of supporting a novel hardware stack. This can easily range from hundreds of thousands to millions of dollars.
The Payback (Benefit): The return comes from the superior p99 latency, which translates into tangible business value:
Higher QPS at SLA: Ability to serve more concurrent users per server while maintaining the latency guarantee.
Improved User Experience: Higher retention and willingness to pay for a responsive service.
Breakeven Analysis: A simplified payback model is: Months to Breakeven = Porting Tax ($) / Monthly Value Gain ($). The “Monthly Value Gain” is the incremental revenue or cost savings from the improved p99 performance.
All in all, investment in alternative silicon is generally only viable if the p99 performance advantage is significant enough for a payback period of less than 18–24 months. Without this clear financial justification, the friction and risk of leaving the incumbent GPU ecosystem are too high.
While we can wax lyrical about the situations around inference (and that is a lot of fun), there is no hardware w/o hard (I really tried here, but transitions are hard, especially if you don’t want to repeat “Next we will cover”/ “This leads to…” every section).
4) The Physical Moats around Diffusion
Beneath every other battle, the entire ecosystem is governed by a set of hard, physical constraints. Constraints born from the physics of computation at scale. The most durable investment theses are found in the companies that provide solutions to these fundamental bottlenecks. These are the true “picks and shovels” of the diffusion economy.
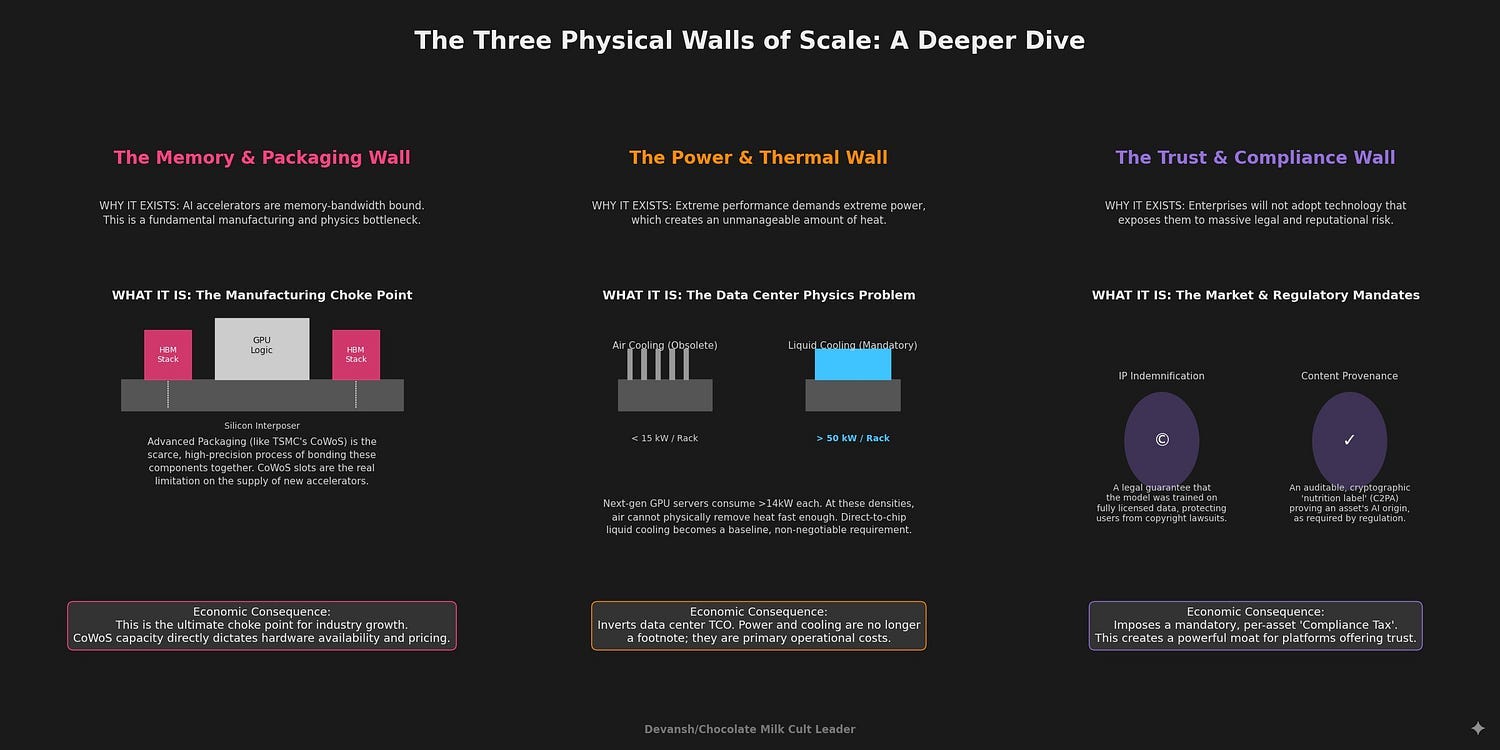
The Memory & Packaging Wall
Diffusion models are memory-bandwidth bound. As we’ve covered in the past, memory overflows can shut your whole system down
The primary constraint on the production of AI accelerators is not the fabrication of the logic die itself, but the supply of two critical components:
High-Bandwidth Memory (HBM): The demand for HBM3e and the forthcoming HBM4 (which doubles the interface width to 2048-bits) far outstrips supply.
Advanced Packaging: More critically, the specialized capacity to bond HBM stacks to logic dies using technologies like TSMC’s CoWoS (Chip-on-Wafer-on-Substrate) is the ultimate choke point for the entire industry. CoWoS slots are a scarcer and more valuable asset than the GPUs themselves. It’s worth noting that all our aspirations of AGI, the entire multi-trillion-dollar AI revolution, is being bottlenecked by what is, spiritually speaking, industrial-grade craft glue. Get them kinds into arts and crafts, I guess.
The Power & Thermal Wall
The performance gains of next-generation accelerators come at a steep cost in power consumption and thermal output. A single Blackwell-class GPU can draw 1.0–1.2 kW, pushing an 8-GPU server chassis to over 14 kW. This has two profound consequences:
Air Cooling is donezo: At these densities, traditional air cooling is no longer viable. Rack-level power densities now routinely exceed 35–50 kW, making direct-to-chip liquid cooling a baseline requirement.
Data Center Economics are Inverted: Power and cooling are no longer footnotes in a TCO model; they are first-order operational costs that can dictate the profitability of an entire AI operation.
The Trust & Compliance Wall
As diffusion models move from novelty to enterprise infrastructure, they are colliding with the realities of intellectual property law and regulation. This creates a mandatory, non-negotiable “Compliance Tax” on every generated asset.
Provenance: The EU AI Act and the industry-led C2PA standard are creating a requirement for auditable content credentials, proving the origin of a generated image.
IP Indemnification: Enterprises will not risk multi-million dollar copyright lawsuits. They will pay a premium for models trained exclusively on licensed, rights-cleared corpora that come with legal indemnification.
Exhibit E6: The Supply-Chain Tornado — Impact on $/1M Images
This exhibit models the sensitivity of the final cost per million images to fluctuations in these physical constraints. It shows how seemingly distant supply chain issues directly impact operational P&L.
Variable Change                      Impact on $/1M Images (Illustrative)
---------------------------------------------------------------------------
HBM Price +30%                       +$8 to +$15
CoWoS Slot Scarcity (-25%)           +$25 to +$50 (due to hardware delays/premiums)
PUE 1.15 -> 1.7 (Poor Cooling)       +$10 to +$20
Power Cost +40% ($/kWh)              +$5 to +$10
Takeaway: A shortage in Taiwanese packaging capacity has a more direct and severe impact on the cost of generating an image in a Virginia data center than incremental improvements in a model’s architecture.
Exhibit E7: Bottleneck → Fix → Vendor Matrix
This matrix maps the physical constraints to the categories of companies providing the solutions.
Bottleneck            Fix                                     Vendor Category
------------------------------------------------------------------------------------------------
Memory & Packaging    HBM3e/HBM4 Manufacturing                Memory Vendors (SK Hynix, Samsung)
                      Advanced Packaging (CoWoS/SoIC)         Foundries/OSATs (TSMC, ASE, Amkor)
                      Next-Gen Interconnects                  Optical I/O, CXL Fabric Vendors

Power & Thermal       Direct-to-Chip/Immersion Cooling        Liquid Cooling Specialists (CoolIT)
                      High-Density Power Distribution         Data Center Infrastructure Vendors
                      AI-Native Data Center Operations        Specialized Colo Operators

Trust & Compliance    Legally Indemnified Training Data       Licensed Data Providers (Getty)
                      Output Provenance & Watermarking        C2PA / Content Credential Services
                      Legally Sterile Synthetic Data          Synthetic Data Generation Companies
Here is the next section.
5) Frontiers that Move TAM
While the current market is defined by the constraints of image generation, two frontiers promise to dramatically expand the Total Addressable Market (TAM). These areas are currently economically or technically challenging, but breakthroughs here will unlock new waves of investment and adoption.
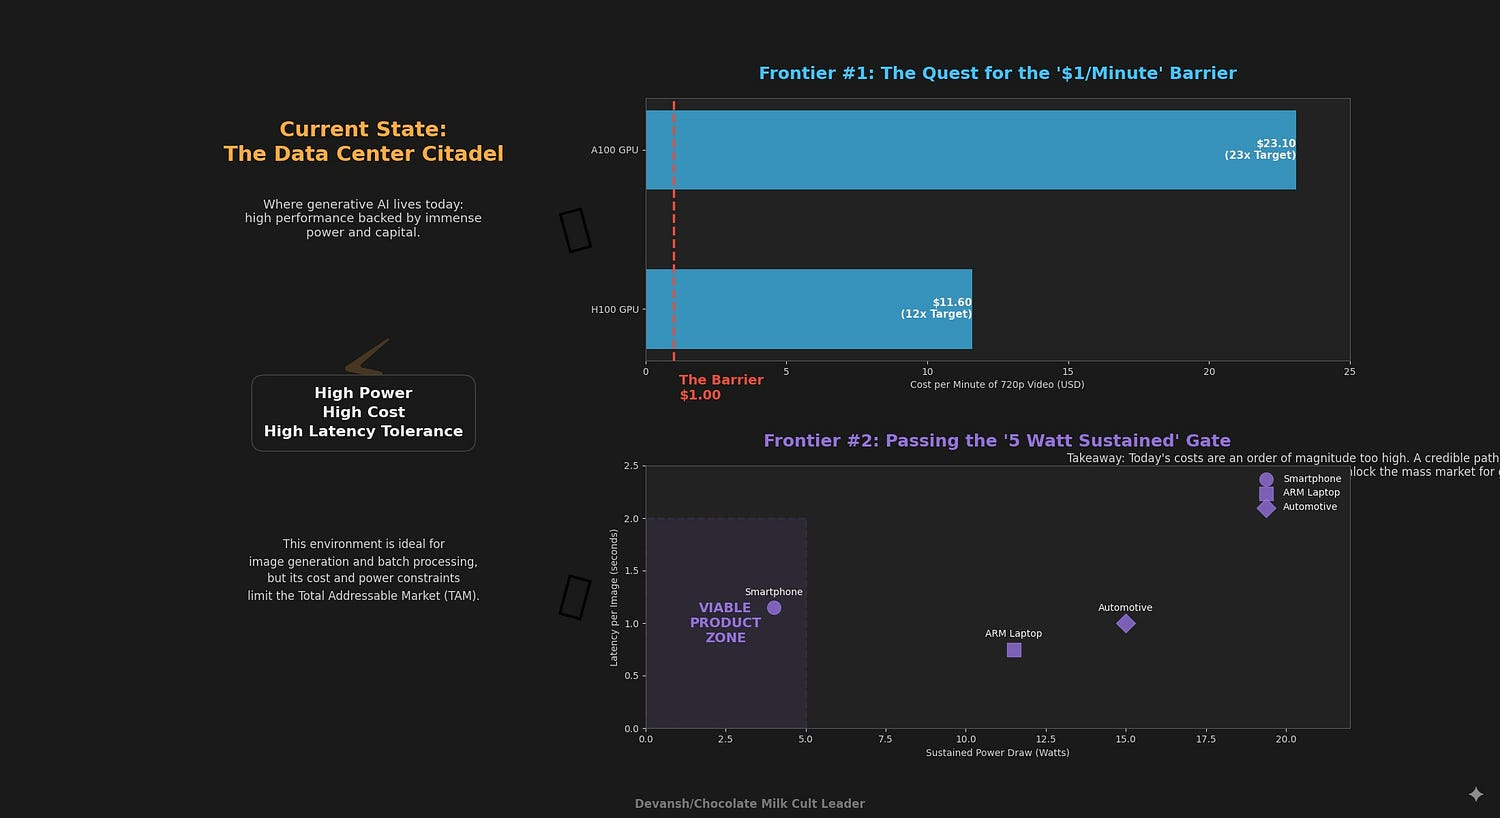
Video Economics: The Quest for the “$1/Minute” Barrier
Generative video is the logical successor to image generation, but it is currently hamstrung by prohibitive costs. The challenge is 3 fold —
Generating individual frames (we still aren’t very good here)
Maintaining temporal consistency across them. Temporal Attention exists, but it’s a bit dodgy.
Integrate audio (another unexplored modality).
Breaking the $1/minute cost threshold is a market aspiration; today’s public diffusion‑video services cost around $10–$20 per minute (e.g., Gen‑3 Alpha runs ≈$15/min). A credible path to sub‑$1/min would transform the market
The current cost for overcoming this barrier is (at least) an order of magnitude too high for widespread use. This gap creates a significant opportunity for specialized hardware (ASICs) or novel software architectures designed specifically for video diffusion kernels (e.g., temporal attention). A company with a credible path to breaking the $1/minute barrier will command enormous market attention.
Edge Feasibility: The “5 Watt Sustained” Gate
The second frontier is moving diffusion from the data center to edge devices like smartphones, laptops, and automotive systems. This unlocks applications in real-time assistance, privacy-preserving generation, and disconnected environments. The challenge here is not peak performance in a short burst, but sustained performance under a strict thermal and power budget.
A viable on‑device product would need to generate images in <2 seconds within a ~5 W power budget for several minutes — a target derived from smartphone thermal limits. Current demos often exceed this or rely on short bursts.
Exhibit E9: On-Device Target Performance Bands (51²², 4-step)
This exhibit outlines the target performance and energy bands for different classes of edge devices. These are the metrics that matter, not theoretical TOPS.
Device Class               Target Latency (s/img)   Power (W)   Energy (J/img)   Key Challenge
------------------------------------------------------------------------------------------------
High-End Smartphone        0.8 - 1.5 s              <5 W        4 - 8 J          Thermal Throttling
ARM Laptop (e.g., M-series)  0.5 - 1.0 s              8 - 15 W    6 - 15 J         Sustained Performance
Next-Gen Automotive        <1.0 s                   10 - 20 W   10 - 20 J        Reliability & Qualification
The edge is a game of energy efficiency (Joules/image), not raw speed. Success requires a co-design of hardware (NPUs), software (quantization, model distillation), and thermal management. Investors should be skeptical of any demo that does not report sustained performance under a realistic power load.
6. Portfolio Construction (Tiers × Time)
Based on the preceding analysis, a coherent investment strategy for the diffusion ecosystem can be constructed. This framework organizes opportunities into four tiers based on risk profile and time horizon, moving from foundational, sector-wide bets to more speculative, high-reward options.
Tier 1 (Core, Now): The Toll Collectors
These are foundational investments in the solutions to the durable, physical constraints of the market. They represent a bet on the overall growth of the sector with low idiosyncratic risk, akin to owning the sector’s beta.
Targets: HBM and advanced packaging supply chain (SK Hynix, TSMC, ASE); liquid cooling and high-density data center infrastructure providers (Vertiv, CoolIT); and provenance/compliance rails (C2PA-as-a-service platforms, indemnified data providers).
Thesis: These companies get paid regardless of which model, hardware architecture, or application wins. They own the unavoidable bottlenecks.
Tier 2 (Growth, 0–18 months): The Efficiency Merchants
These are software and service companies that sell pure ROI by maximizing the efficiency of expensive hardware. Their product is priced by the infrastructure dollars they save their customers.
Targets: Inference optimization stacks (samplers, compilers, compression toolkits) that reduce step counts and improve hardware utilization; and managed platforms that abstract away the complexity of serving models at a guaranteed p99 SLA.
Thesis: As hardware costs remain high, the demand for software that reduces OpEx is intense and immediate.
Tier 3 (Venture, 12–36 months): The Workflow Specialists
These are vertical application companies with deep, defensible moats. The moat is not the AI model itself, but its deep integration into a regulated, high-stakes, or complex customer workflow.
Litmus Test: The key is a high switching cost. A business is only defensible if the customer faces a significant, quantifiable barrier to leaving.
Exhibit E10: Switching-Cost Table (Illustrative for AEC Vertical)
Component                                 Cost to Switch
---------------------------------------------------------
Proprietary Data Re-acquisition/Licensing $1.5M - $3.0M
Data Cleaning, Labeling & Legal Vetting   $1.0M - $2.0M
Validation Pipeline & Expert Hours        $1.0M - $2.5M
Regulatory Re-certification             $0.8M - $1.5M
---------------------------------------------------------
Total Switching Cost per Logo             $4.3M - $9.0M
Revenue Insulation Test: A strong workflow moat should allow a company to maintain high gross margins (≥70%) and net dollar retention (NDR ≥130%) even in the face of a significant (e.g., 40%) drop in underlying API costs.
Thesis: Invest in the workflow, not the wrapper. The value is in the verification, certification, and data integration around the AI, not the AI output itself.
Tier 4 (Options, 18–60 months): The Game Changers
These are high-risk, high-reward bets on technologies that could fundamentally alter the current market equilibrium.
Targets:
Deterministic Silicon: Challengers who can prove a >3x p99 latency advantage after accounting for the Porting Tax, unlocking the interactive application market.
Video Platforms: Companies with a credible software or hardware path to breaking the “$1/minute” economic barrier.
Next-Gen Fabrics: Optical interconnect and CXL 3.0+ vendors who can solve the memory wall at the data center scale, but whose success depends on software ecosystem maturity.
Thesis: These are calculated options on the next phase of the market. Success is not guaranteed, but a winner in any of these categories will capture an enormous new TAM.
7) Risks & Counter-Theses
Here are some risks/challenges to our current framework. Watching out for them is a must.
One-Step Parity Becomes Universal: If research breakthroughs lead to one-step, open-source models that achieve quality parity with multi-step proprietary models for nearly all tasks, the value of specialized inference software and hardware could diminish. The entire stack would commoditize faster, returning value primarily to general-purpose silicon (GPUs) and the application layer. This is the least likely to happen.
Architectural Drift to Transformers (DiT/Flows): The underlying architecture of diffusion models may continue to evolve, becoming more transformer-heavy (e.g., Diffusion Transformers or DiTs). This could change the kernel mix of the workload, favoring hardware and software stacks already optimized for large transformer models (like those for LLMs) and potentially eroding the specific moats of diffusion-centric ASICs. Diligence Requirement: Demand DiT-parity benchmarks from any hardware vendor.
Supply Chain Slips Extend Incumbency: Significant delays in the ramp-up of HBM4 or advanced packaging capacity would starve the market of next-generation accelerators. This would extend the incumbency of the current GPU generation (e.g., H100/H200) by another 6–12 months, delaying the timeline for challengers and altering the TCO calculations for all players. Action: Re-price $/image bands and payback models if foundry/memory roadmaps slip by more than two quarters.
Regulatory Hardening Becomes a Margin Tax: We model a $0.02–$0.10 internal compliance allocation per asset to cover provenance, auditing, and licensed data premiums. Actual costs vary by vendor and volume. A more stringent regulatory environment, or a series of high-profile IP lawsuits, could impose much higher costs for provenance, licensing, and auditing. This would disproportionately harm smaller players and favor large, vertically integrated companies that can absorb the compliance burden.
2–3 seem to be the most pressing issues to address, while 4 will address all kinds of models equally, so it will likely be distributed across the industry.
Conclusion: Bet on the Bottlenecks
Diffusion has passed the hype cycle. The models themselves are already trending toward commodity — cheaper, faster, and more plentiful with every software release. The real levers of value are in the physics and the constraints that no algorithm can wave away.
The “steps tax” proved how quickly software can collapse costs; that dividend flows straight to incumbents with mature toolchains. The throughput market belongs to GPUs. The only open flank is latency: challengers who can prove deterministic p99 performance at scale may yet carve out space.
Beyond that, the durable moats are brutally simple:
Memory and packaging capacity set the ceiling for how many accelerators exist.
Power and cooling determine whether those accelerators can run at density.
Provenance and compliance decide whether enterprises can use the outputs legally.
Everything else is noise.
For investors, the rule is clear: don’t chase the next model release. Build exposure to the bottlenecks — HBM vendors, packaging houses, cooling providers, compliance rails — and layer in selective bets on step-cutting software, workflow-moat applications, and latency-first silicon. After all, the ones who control the logistics will walk out as the ultimate winners.
Thank you for being here, and I hope you have a wonderful day,
It turns out the real AI alignment problem is aligning your HBM order with TSMC’s packaging schedule. Everything else is just a rounding error.
Dev <3
If you liked this article and wish to share it, please refer to the following guidelines.
That is it for this piece. I appreciate your time. As always, if you’re interested in working with me or checking out my other work, my links will be at the end of this email/post. And if you found value in this write-up, I would appreciate you sharing it with more people. It is word-of-mouth referrals like yours that help me grow. The best way to share testimonials is to share articles and tag me in your post so I can see/share it.
Reach out to me
Use the links below to check out my other content, learn more about tutoring, reach out to me about projects, or just to say hi.
Small Snippets about Tech, AI and Machine Learning over here
AI Newsletter- https://artificialintelligencemadesimple.substack.com/
My grandma’s favorite Tech Newsletter- https://codinginterviewsmadesimple.substack.com/
My (imaginary) sister’s favorite MLOps Podcast-
Check out my other articles on Medium. :
https://machine-learning-made-simple.medium.com/
My YouTube: https://www.youtube.com/@ChocolateMilkCultLeader/
Reach out to me on LinkedIn. Let’s connect: https://www.linkedin.com/in/devansh-devansh-516004168/
My Instagram: https://www.instagram.com/iseethings404/
My Twitter: https://twitter.com/Machine01776819